Debugging
In Browser
Browsers ship with their own developer tools. These are amazing tools to help you debug your web application. Consider learning how to use them.
Visual Studio Code
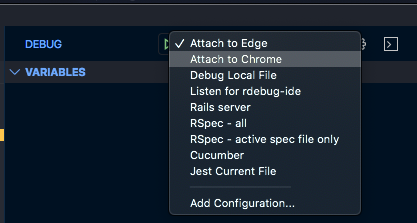
Visual Studio Code (VS Code) is a popular editor that allows you to debug many languages including JavaScript. Thanks to remote debugging technologies, we can debug our frontend code in VS Code. When you clone the Forem repository and open the project in VS Code, you will be prompted to install recommended extensions which include the Chrome Debugger and the Edge Debugger.
Setup:
- Refer to the respective debugger extension documentation above to ensure that your browser is running with remote debugging enabled.
- Once you have your local installation of Forem running, you can attach to either the Chrome or Edge Debugger.

- From there you can do all the usual stuff that you would do while debugging JavaScript in the browser: setting breakpoints, setting logpoints, watches etc.
Where is My Editor Debug Configuration?
If you do not see your editor here, consider contributing to the documentation. 😉
Preact Developer Tools
Preact has their own developer tools in the form of a browser extension. The Forem codebase is configured out of the box to support the Preact Devtools.